

From Space data to participant data, get the right information and prepare a better lecture/course according to specific needs.
Check the ‘Insights’ page on the CLASSUM website! (PC, Laptops O / Mobile X)
Space Insights are only available for Premium Users. Please consult our support team if you want to know more about the Premium plan. [1-on-1 Support]
[1-on-1 Support]1. Location

•
Activity Management is only accessible to Space Admins and Organization Admins.
•
Organization Admins’ posts and interactions are excluded from the data.
•
Deleted posts and canceled interactions are not included in the data.
•
The data of members that have left the Space (including withdrawal) remains.
•
All data is updated every 30 minutes.
2. Space Insight
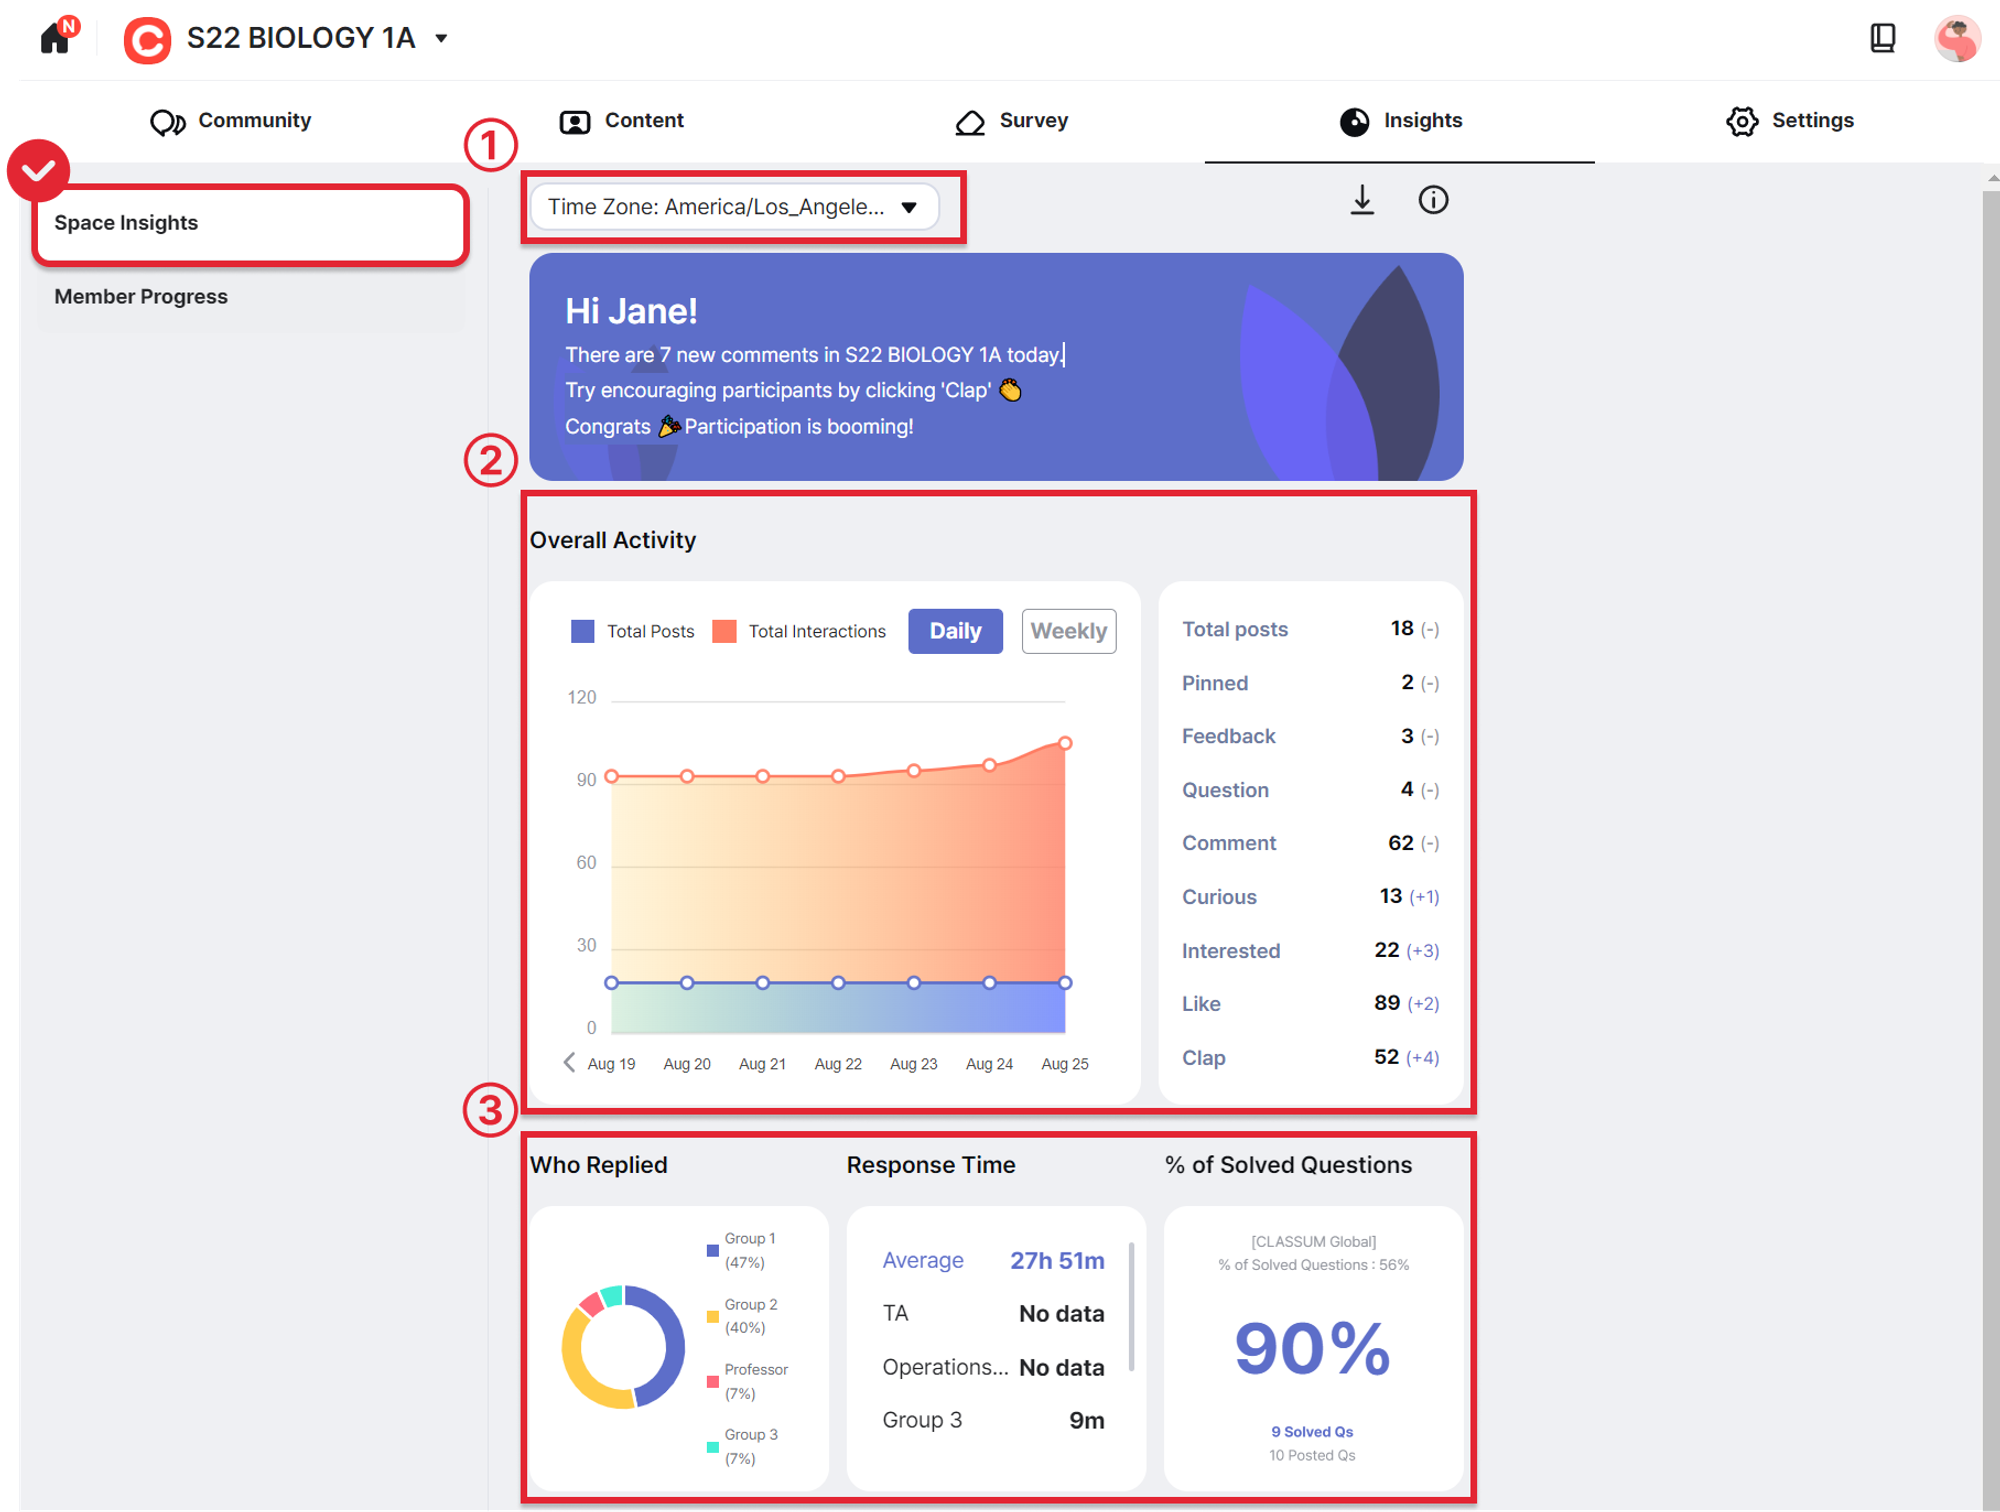
(Picture 1) Space Insight - 1
① Time Zone: You can change the timezone as you wish.
② Overall Activity: Accumulated number of posts and interactions (Likes, Claps, Curious, Interested, etc).
③-① Who replied: The proportion of accumulated replies made by all members (by role).
③-② Response time: The average time taken from the time the question was posted to the first reply for that respective question.
③-③ % of Solved Questions: Percentage of solved questions in your Space.
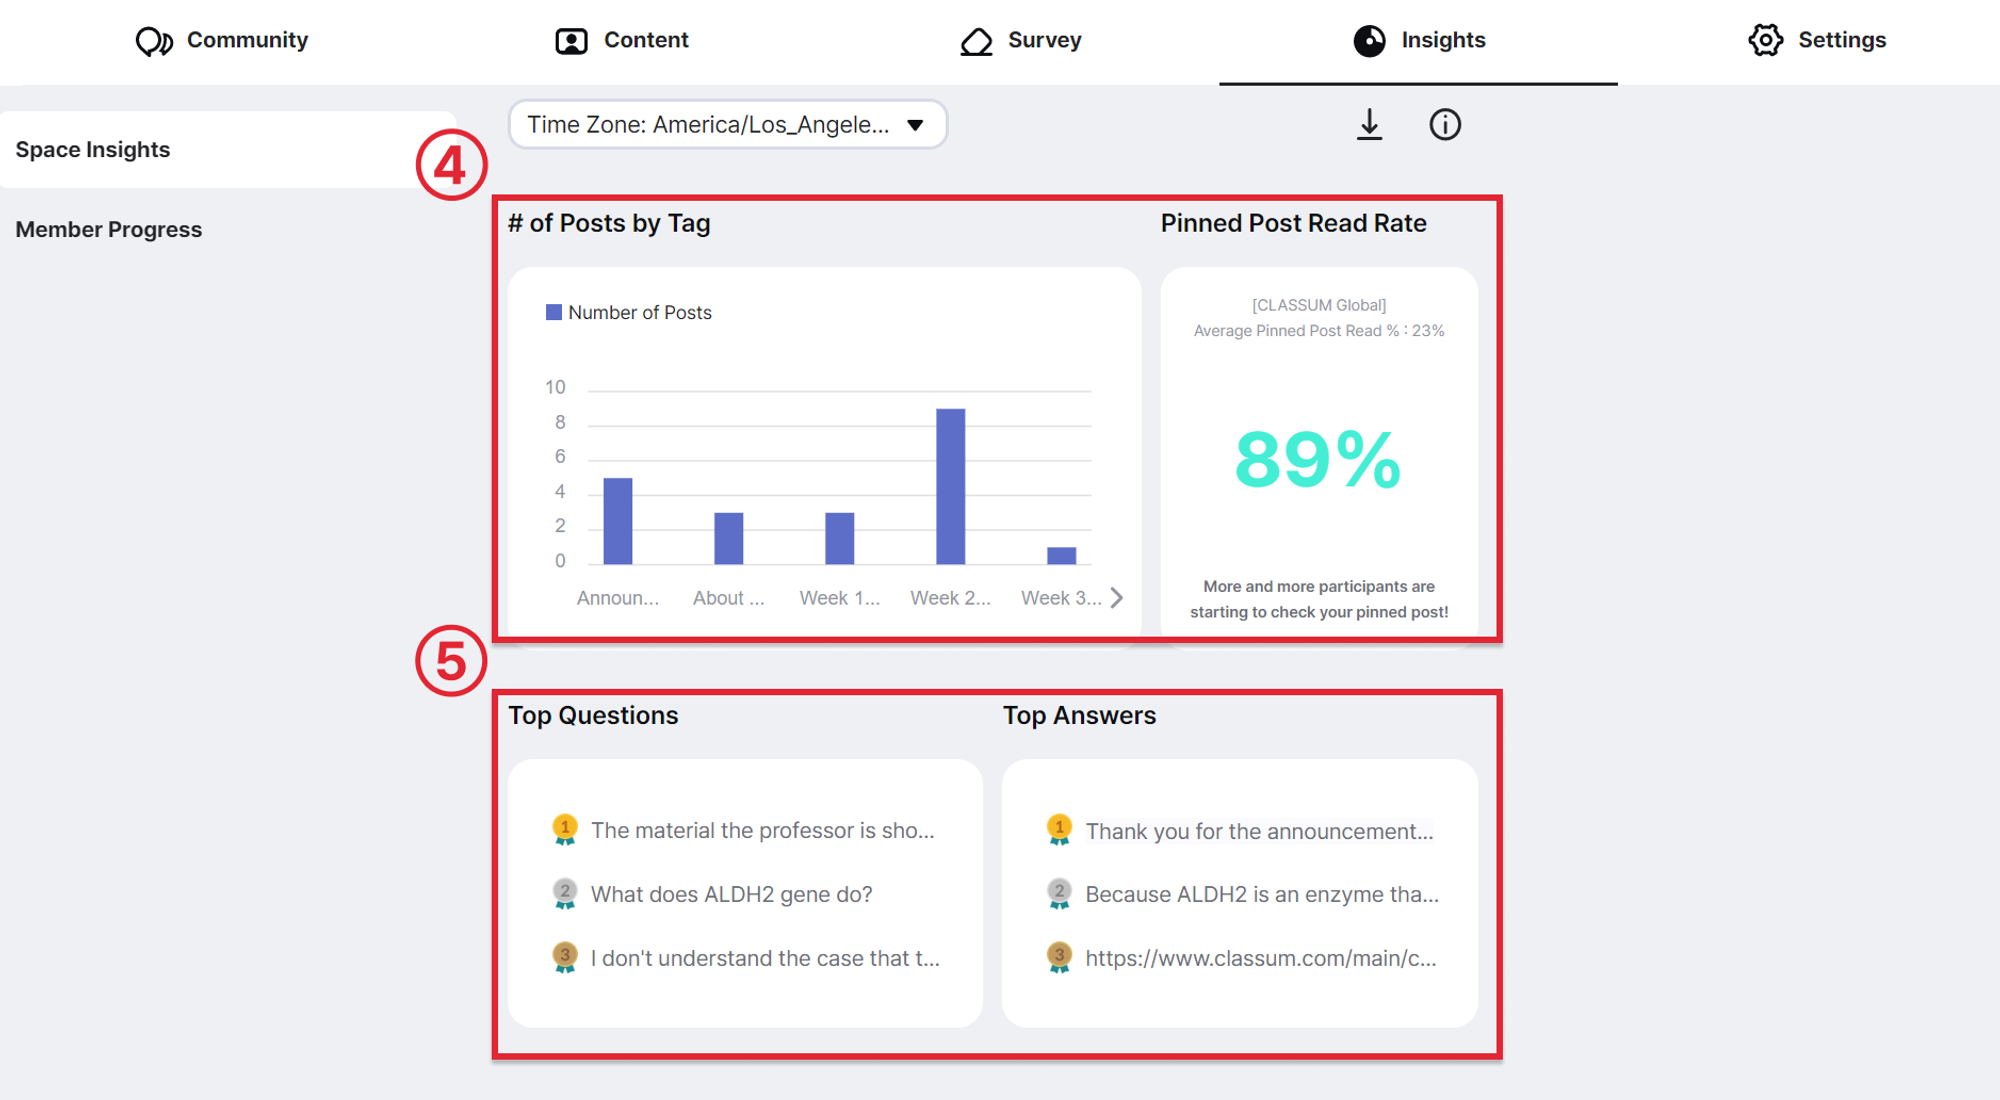
(Picture 2) Space Insight -2
④-① # of Posts by Tags: You can check which tags have the most number of posts to understand how participants are doing and prepare for future lectures.
④-② Pinned Post Read Rate: Percentage of announcements read in your Space in comparison to the entire organization → use the Renotify Feature to renotify announcements
⑤ Top Questions, Top Answers: You can check the questions and answers that are receiving the most amount of attention.
3. Member Progress - (1) Community
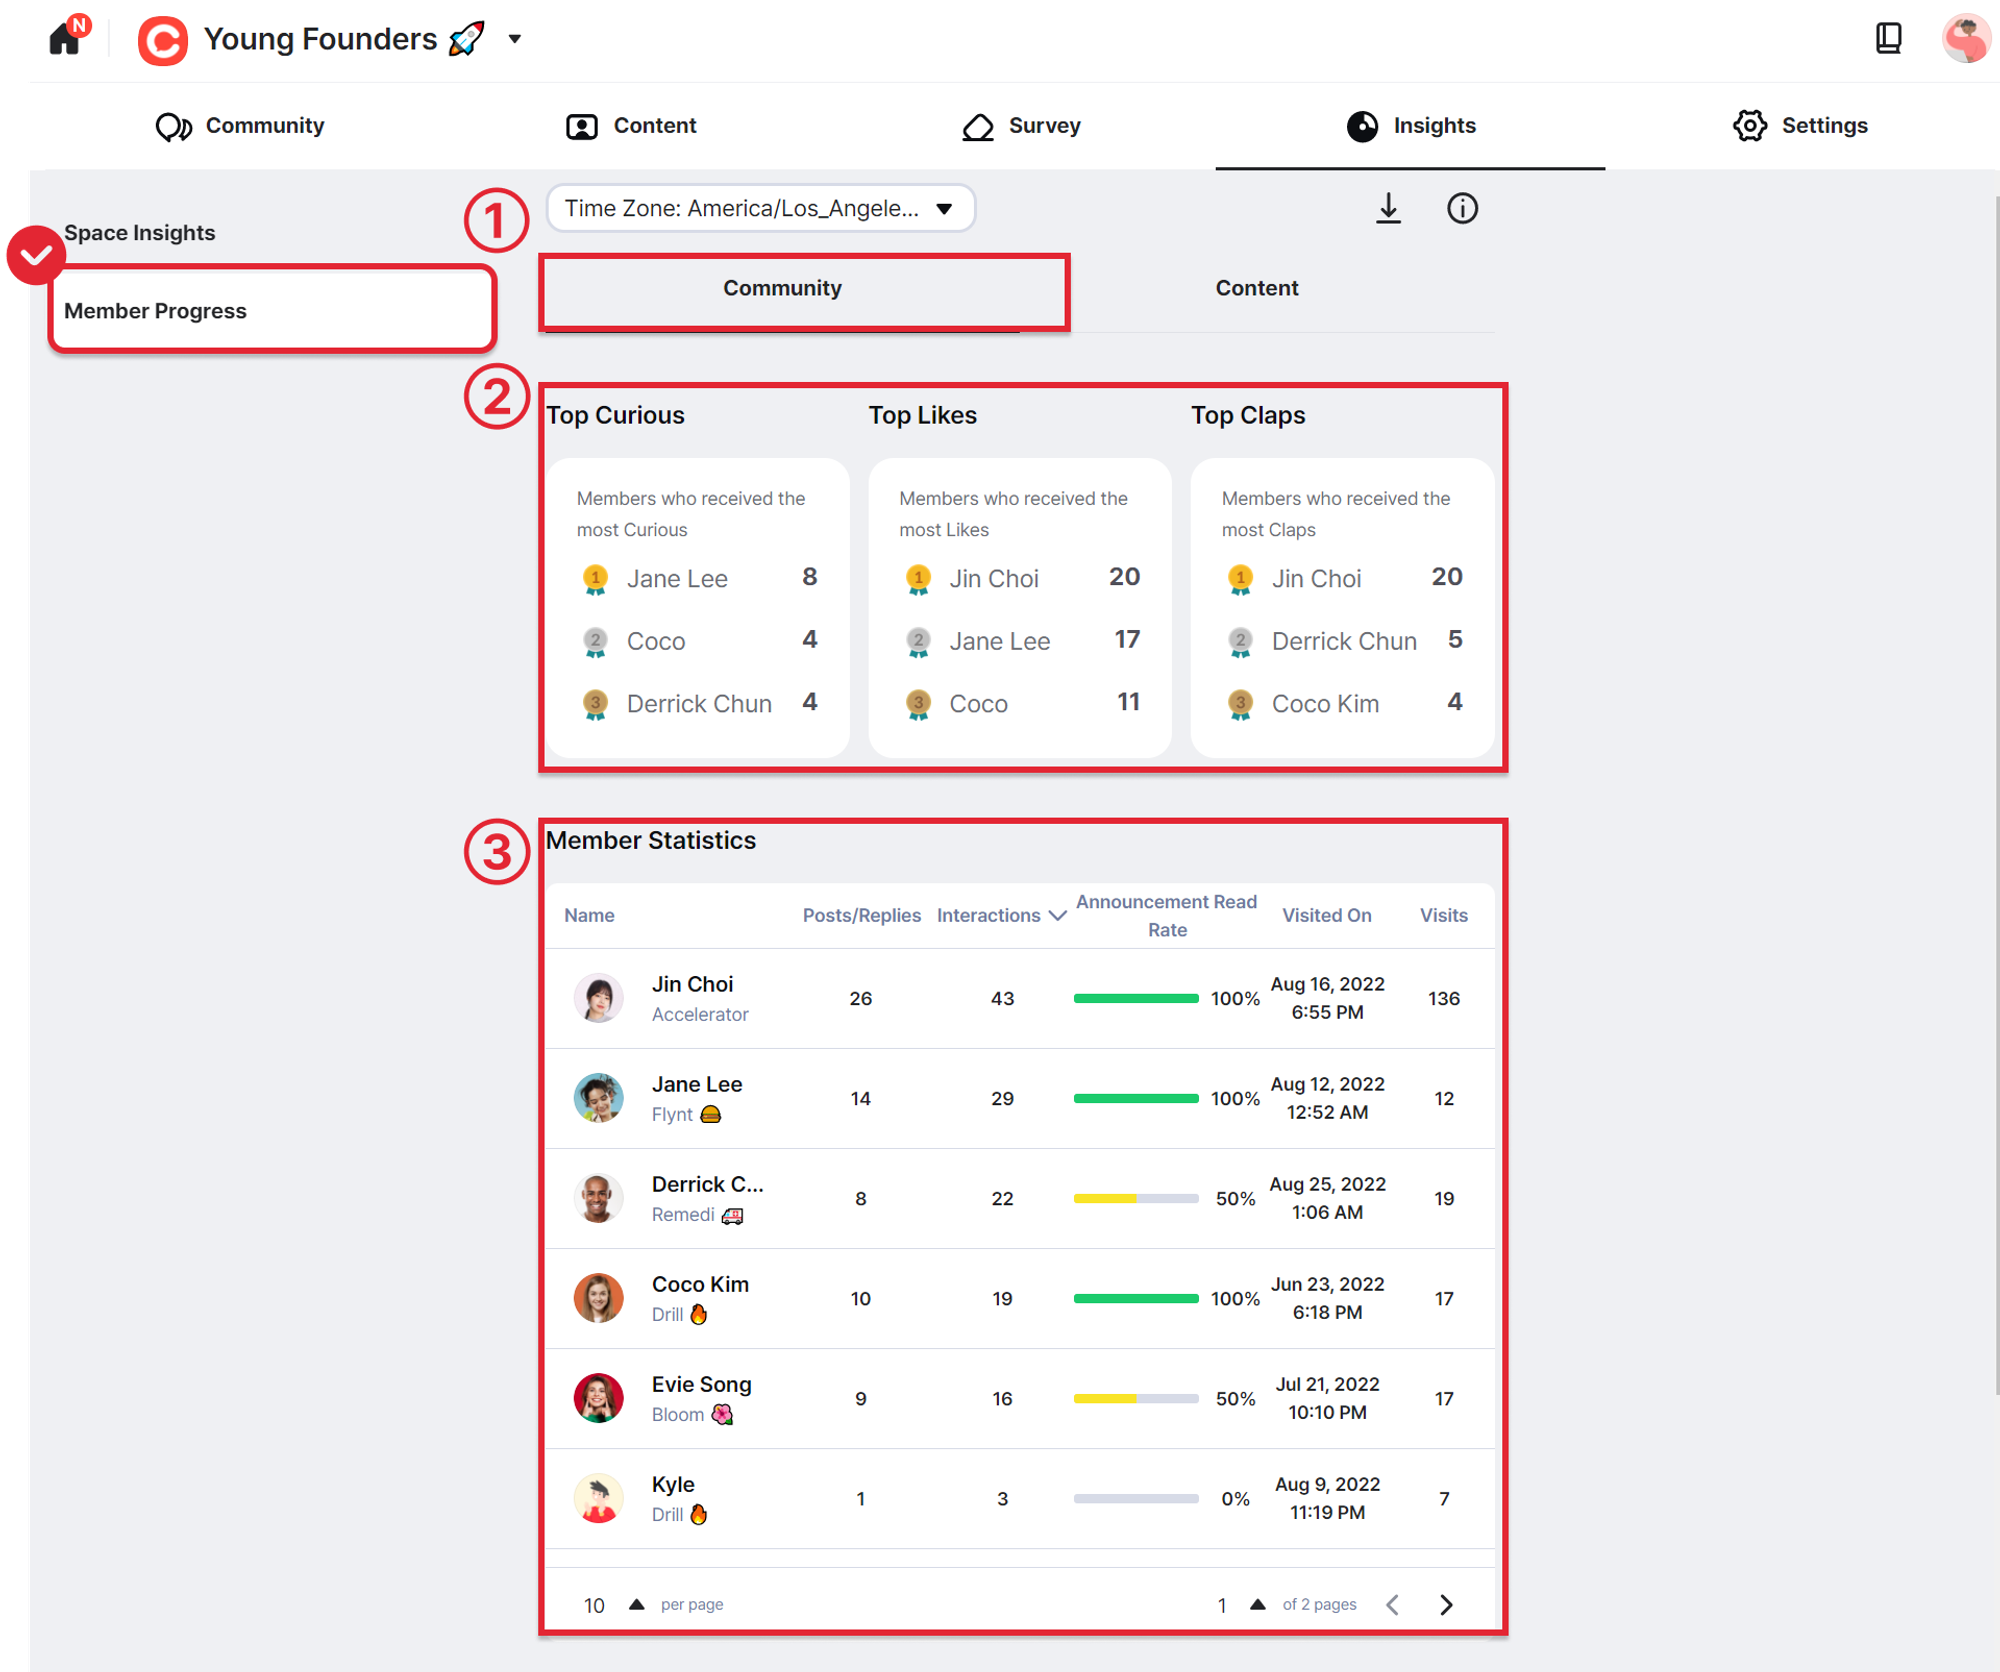
(Picture 3) Member Progress - (1) Community
① You can check each member’s interaction levels and participation rates.
② Top Curious, Top Likes, Top Claps: You can take a look at how the participants are doing and identity the most active participants
※ However, the (Likes) on the comments in the feedback posts are excluded from the data.
(Likes) on the comments in the feedback posts are excluded from the data.③ Member Statistics : You can check each member’s activities in ascending/descending order.
※ Hover your mouse over the Post/Reply and the Interaction section to check the specific data of the respective member.
4. Member Progress - (2) Content
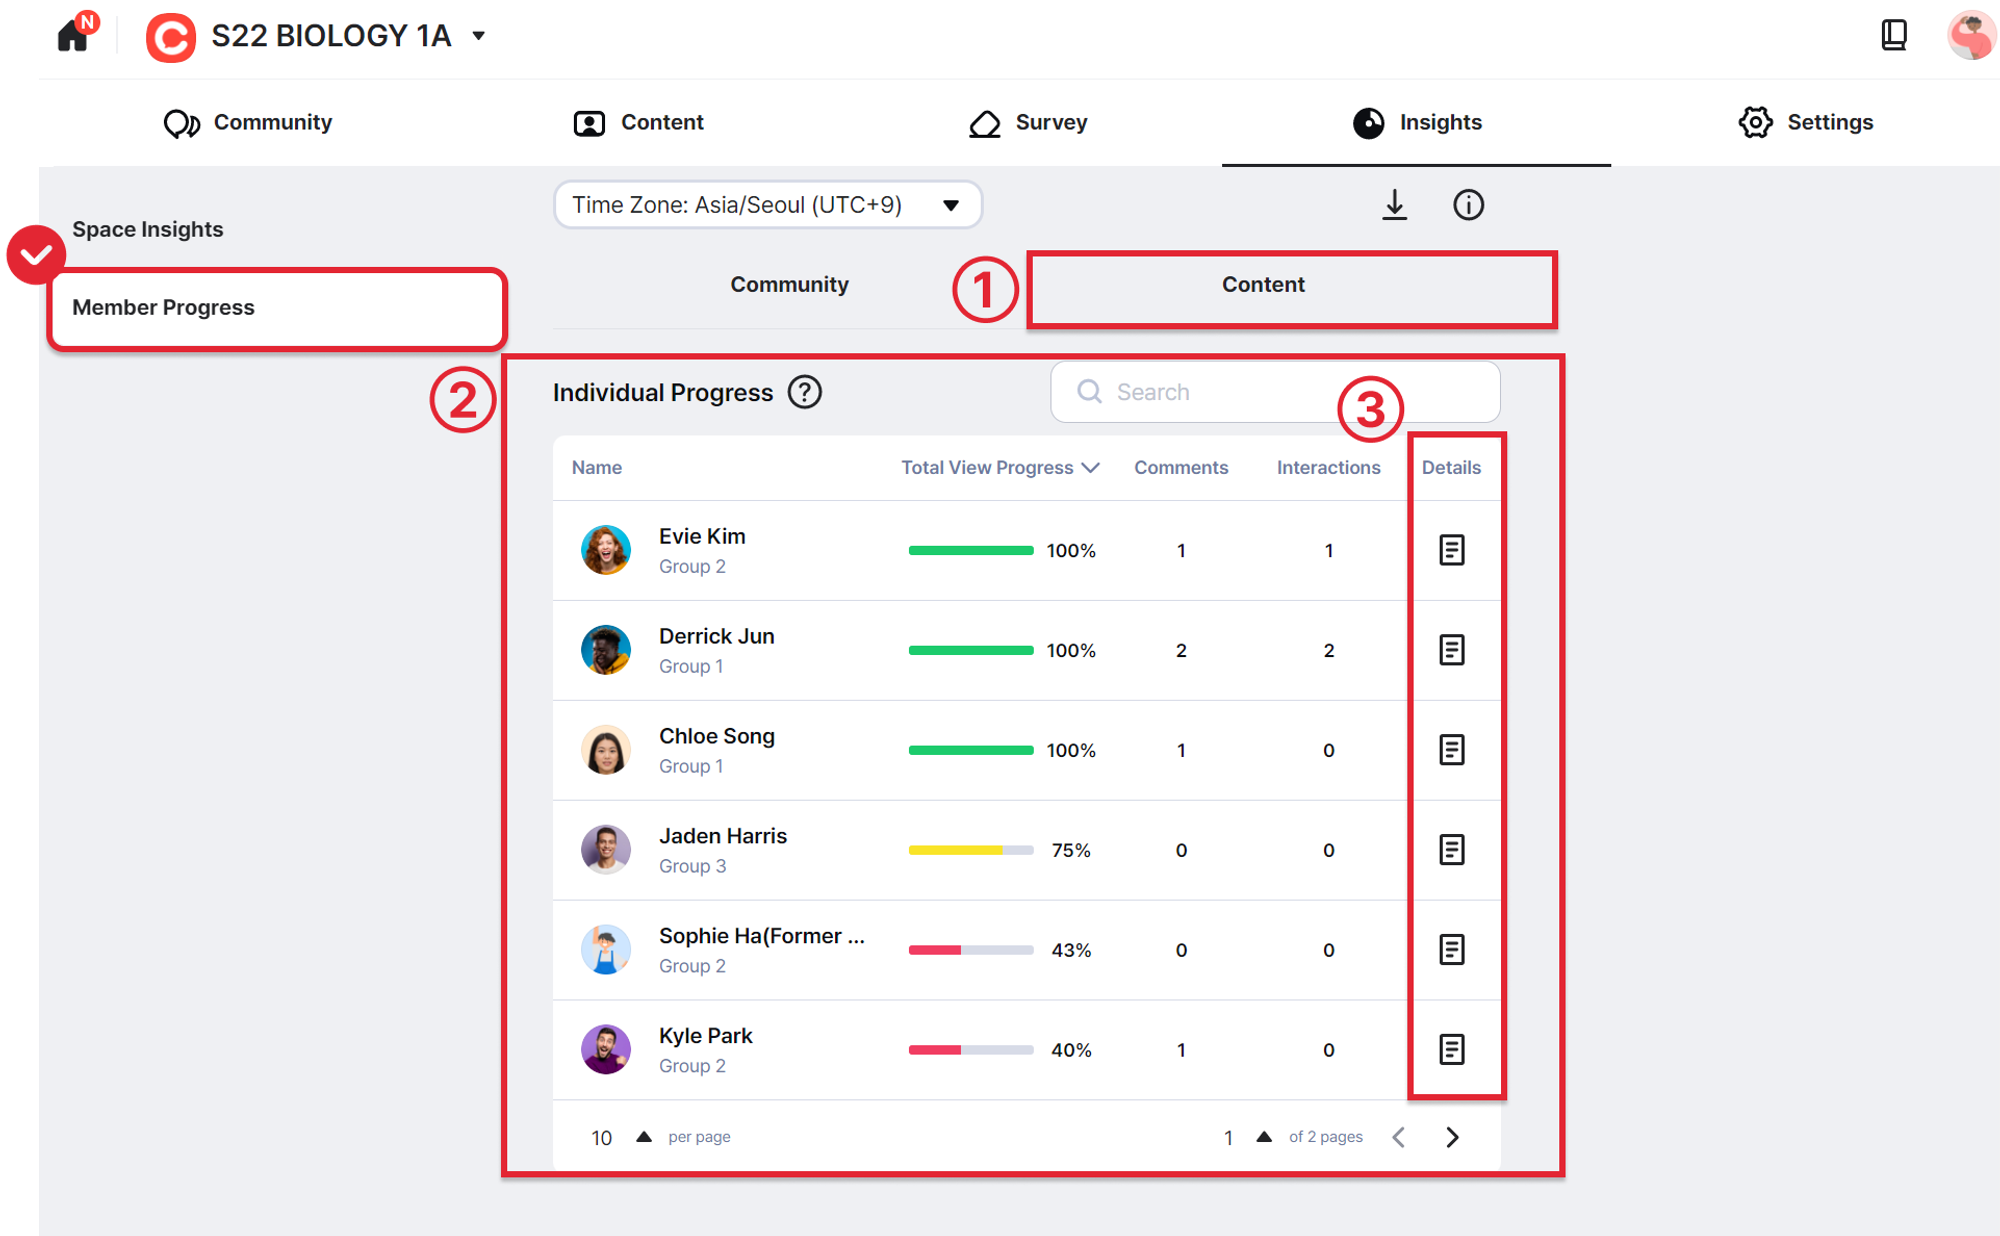
(Picture 4) Member Progress - (2) Content
① You can check each member’s content activities and their video lecture progress.
② Member Statistics: You can check each member’s activities in ascending/descending order.
③ Details: If you click the Detail Button next to the individuals, you can see individual course statistics for each member.
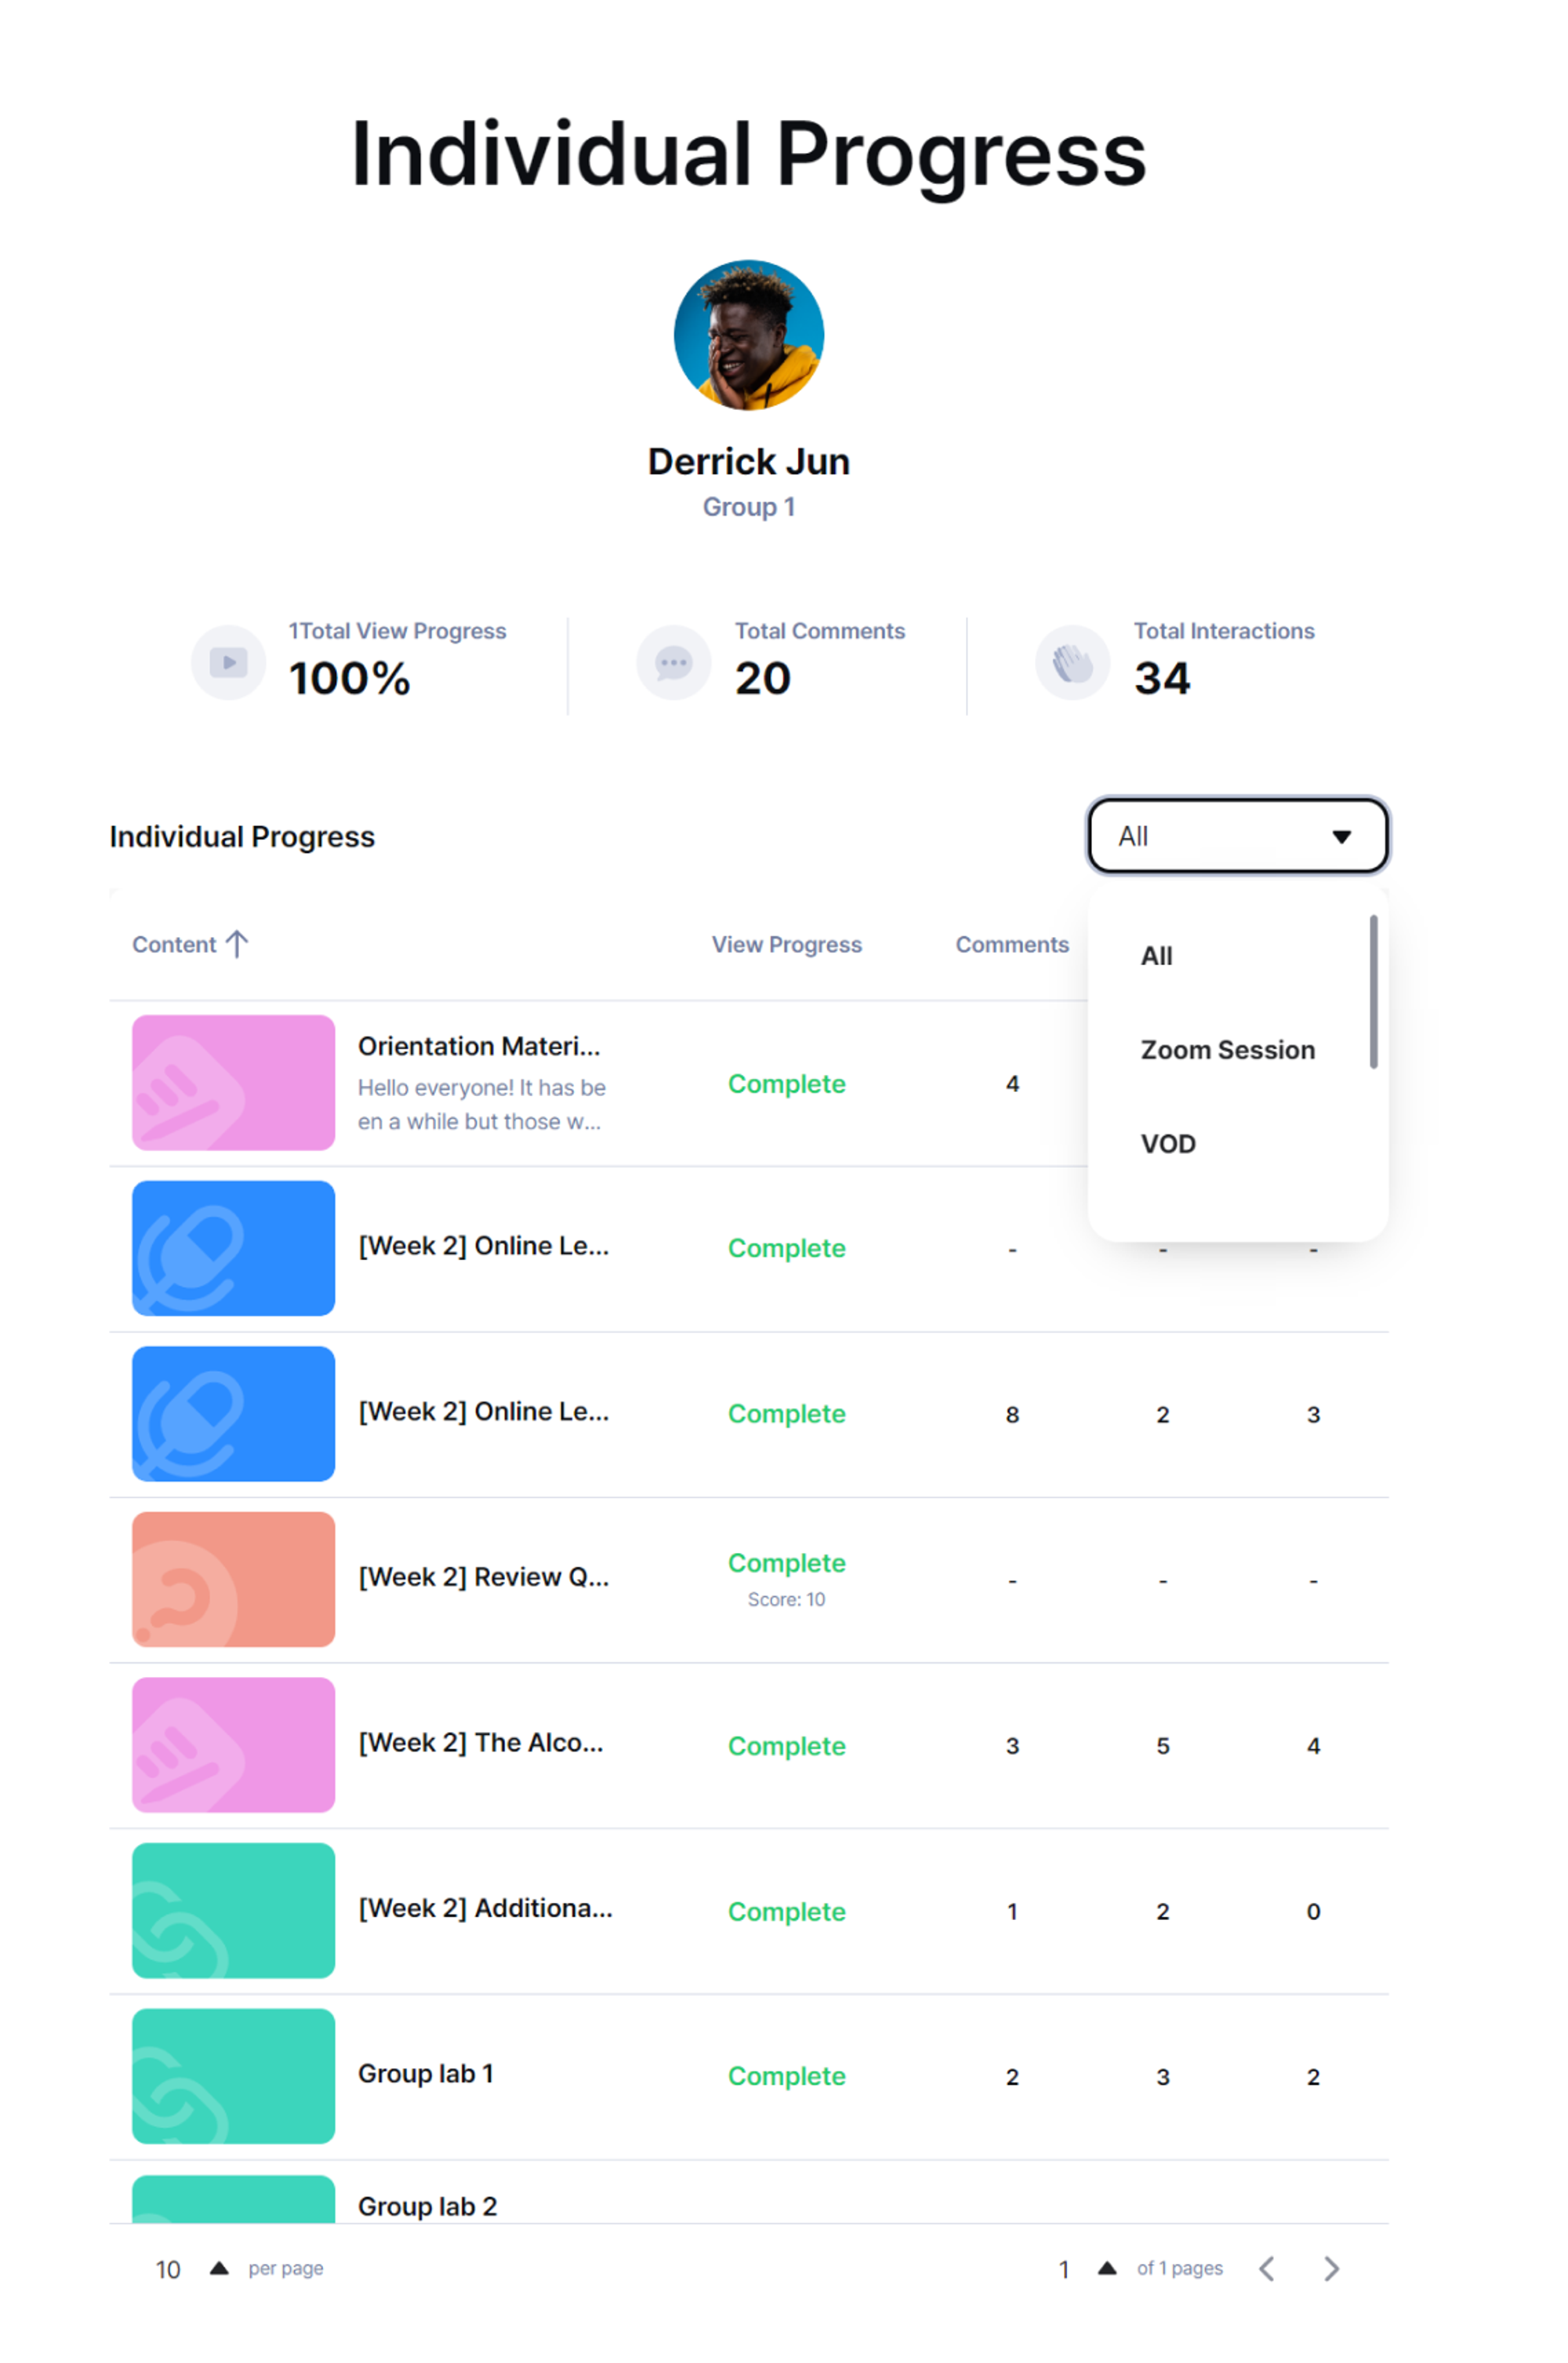
What isVideo Lecture Progress?
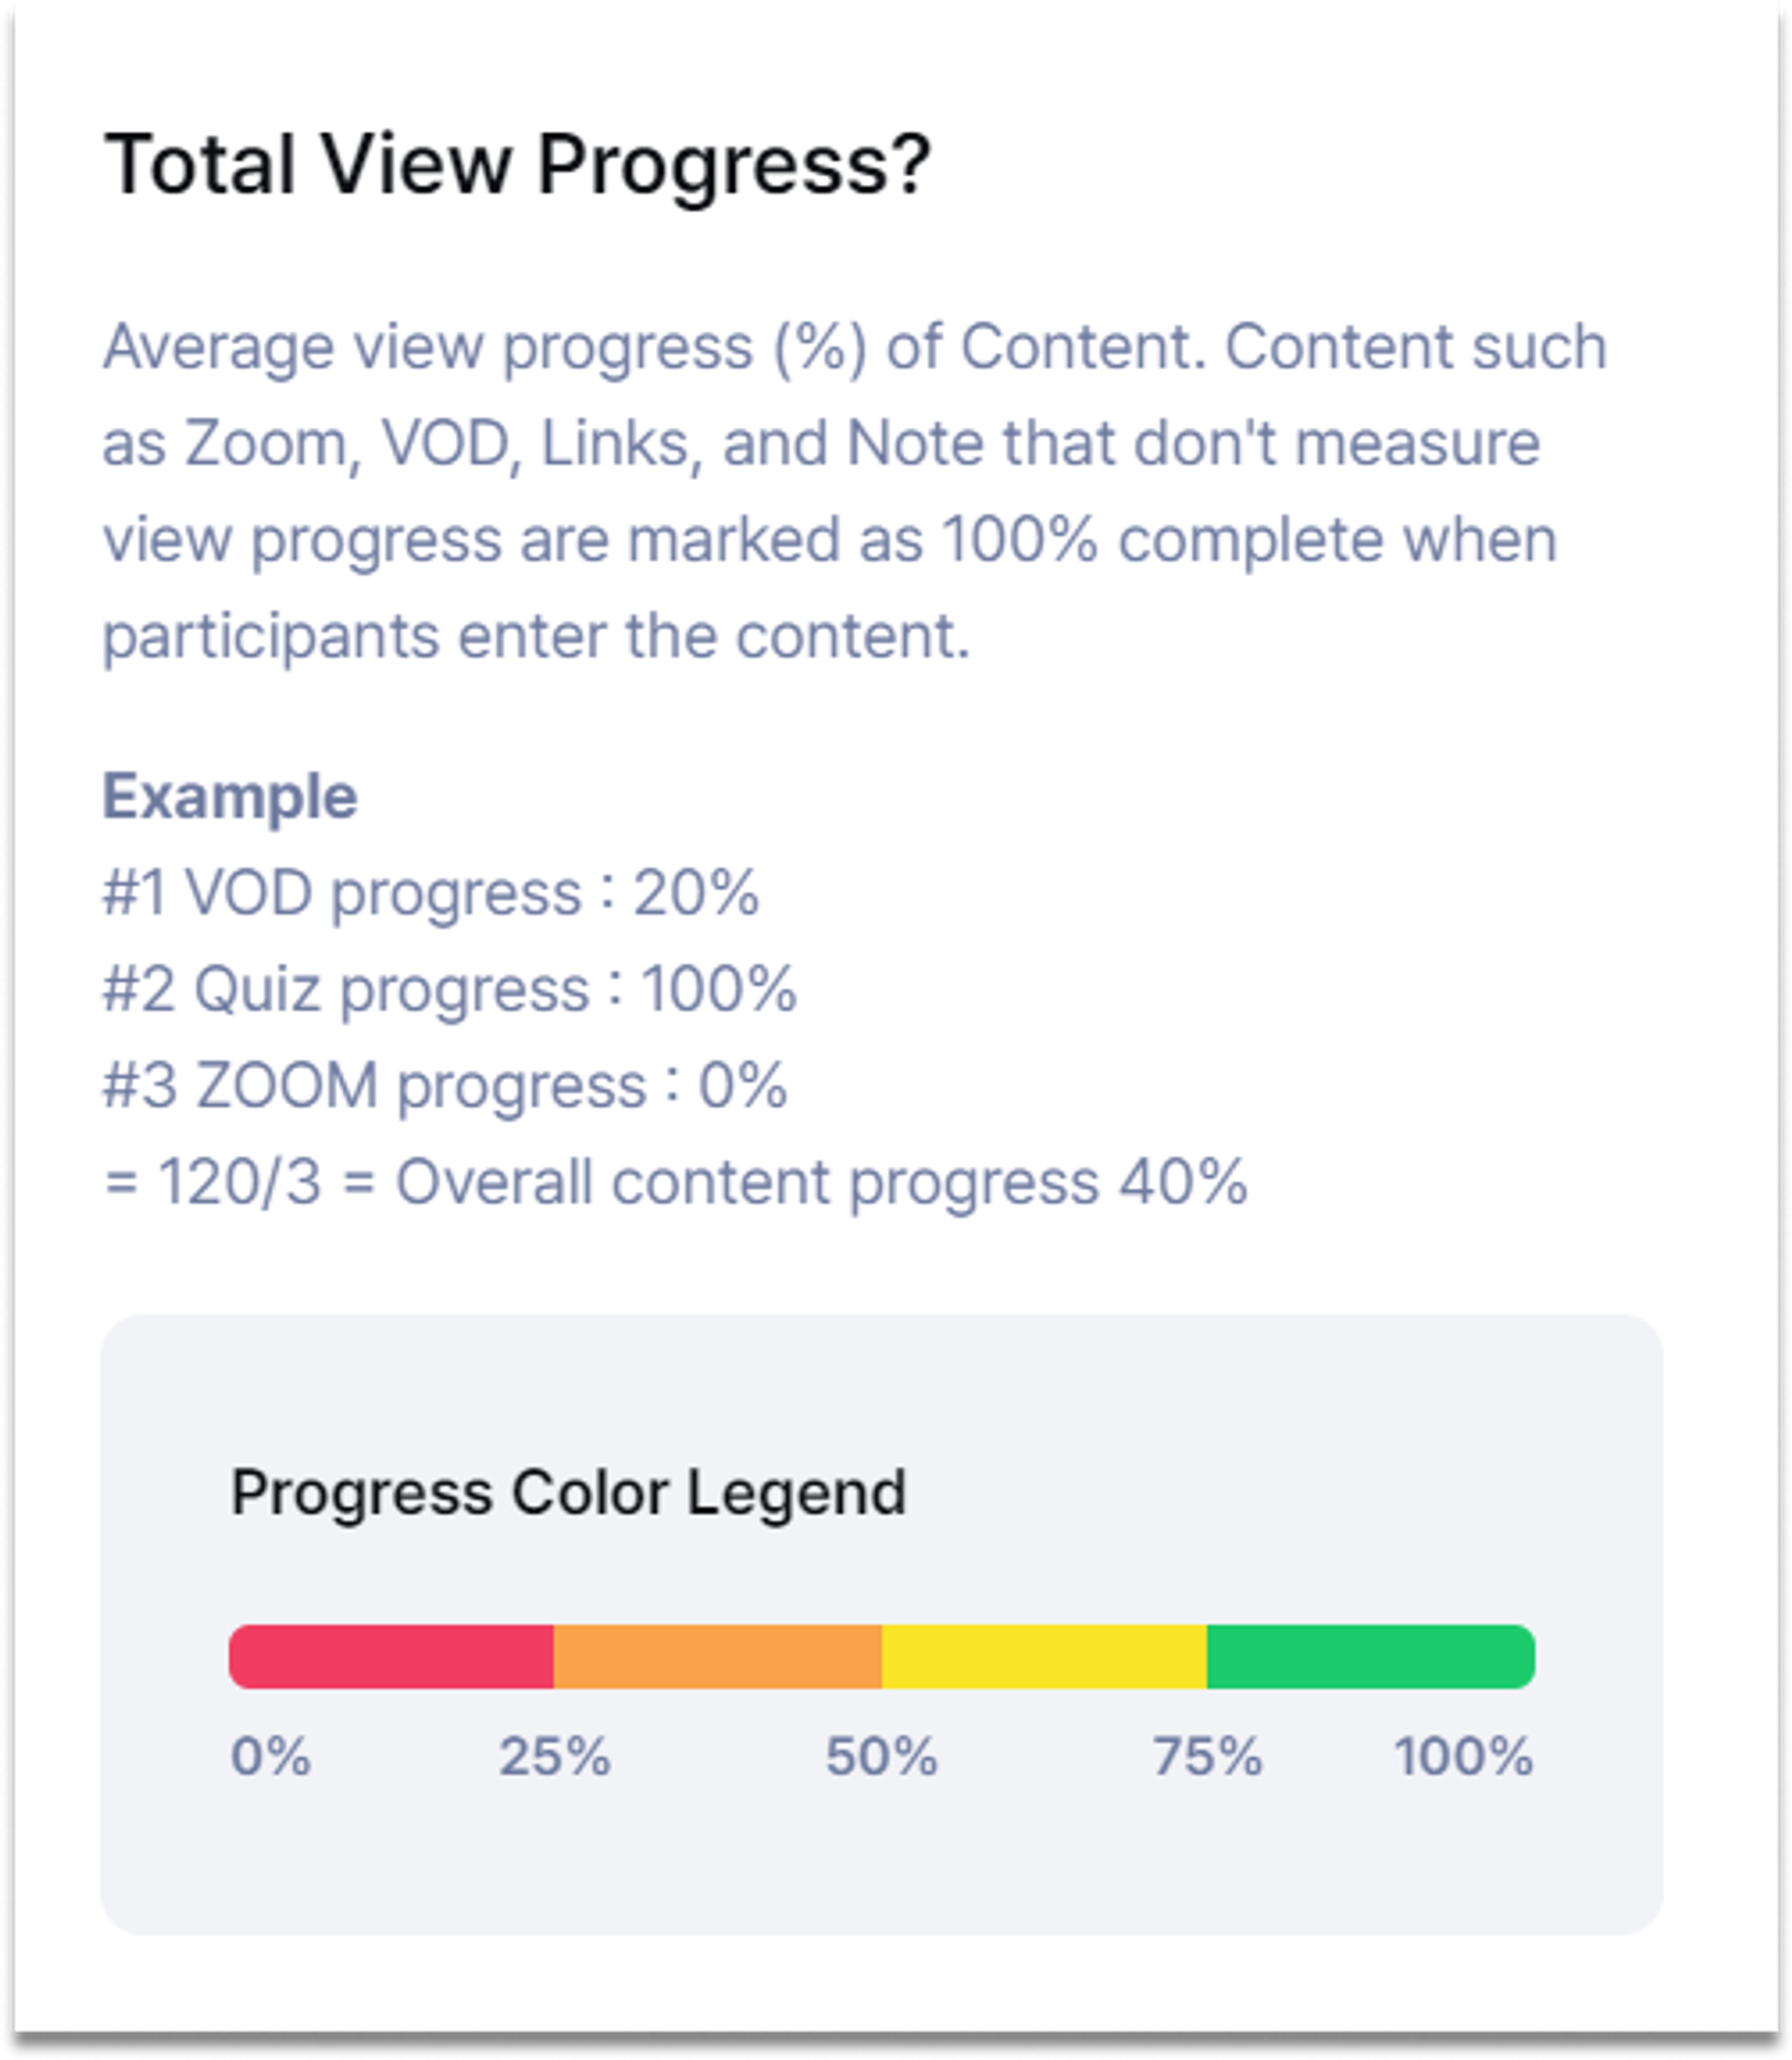
Definition of video lecture progress
※ You can check the chat count and interaction status of each lecture content (video lectures, quizzes) separately.
※ However, video lectures using Zoom and YouTube/Vimeo videos are not measured for completion rate.
5. How to properly use data analytics
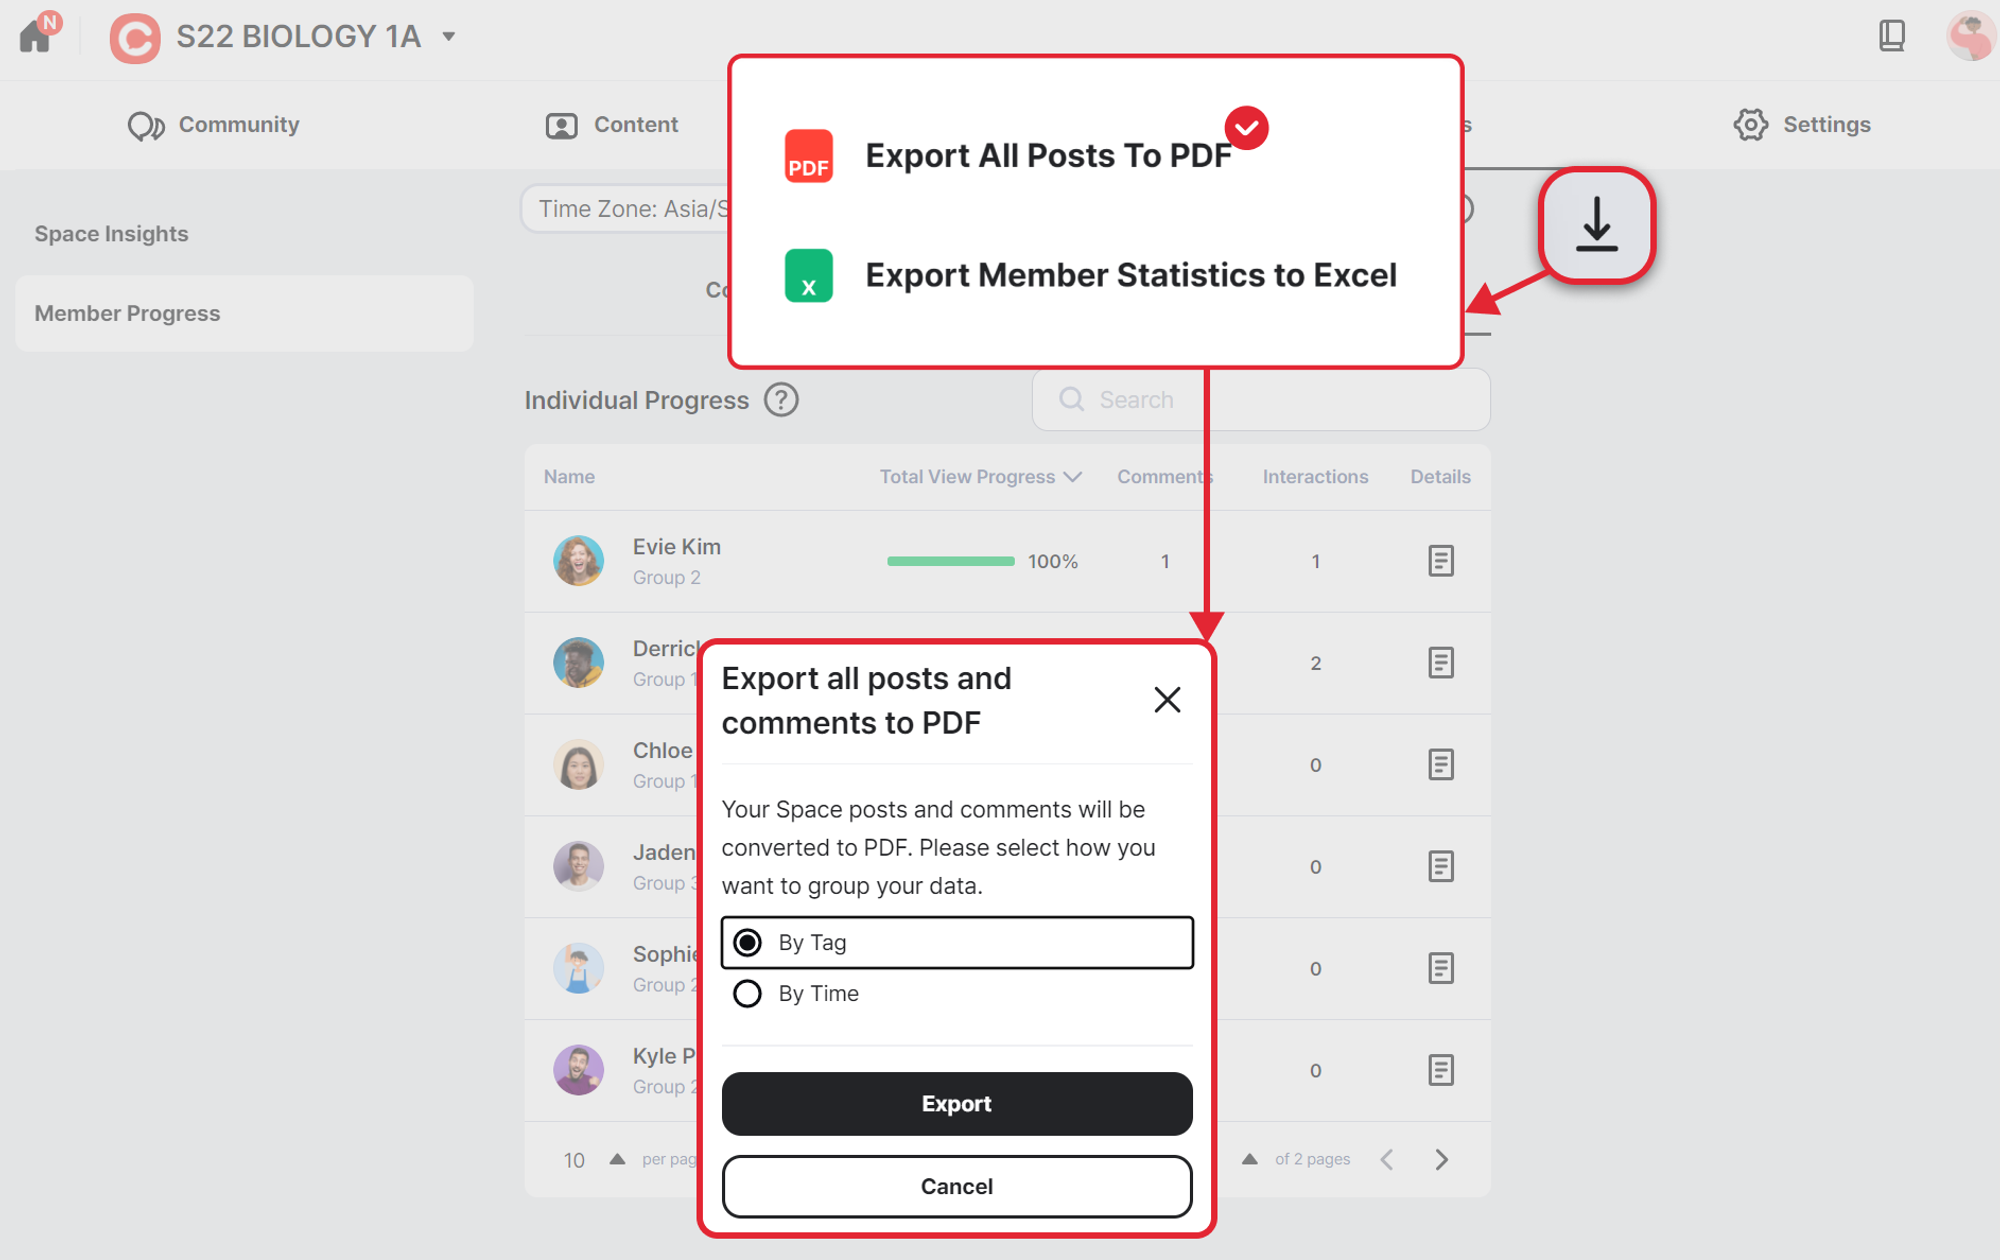
① Export All Posts to PDF: You can download the posts and comments of a certain Space as a PDF file.
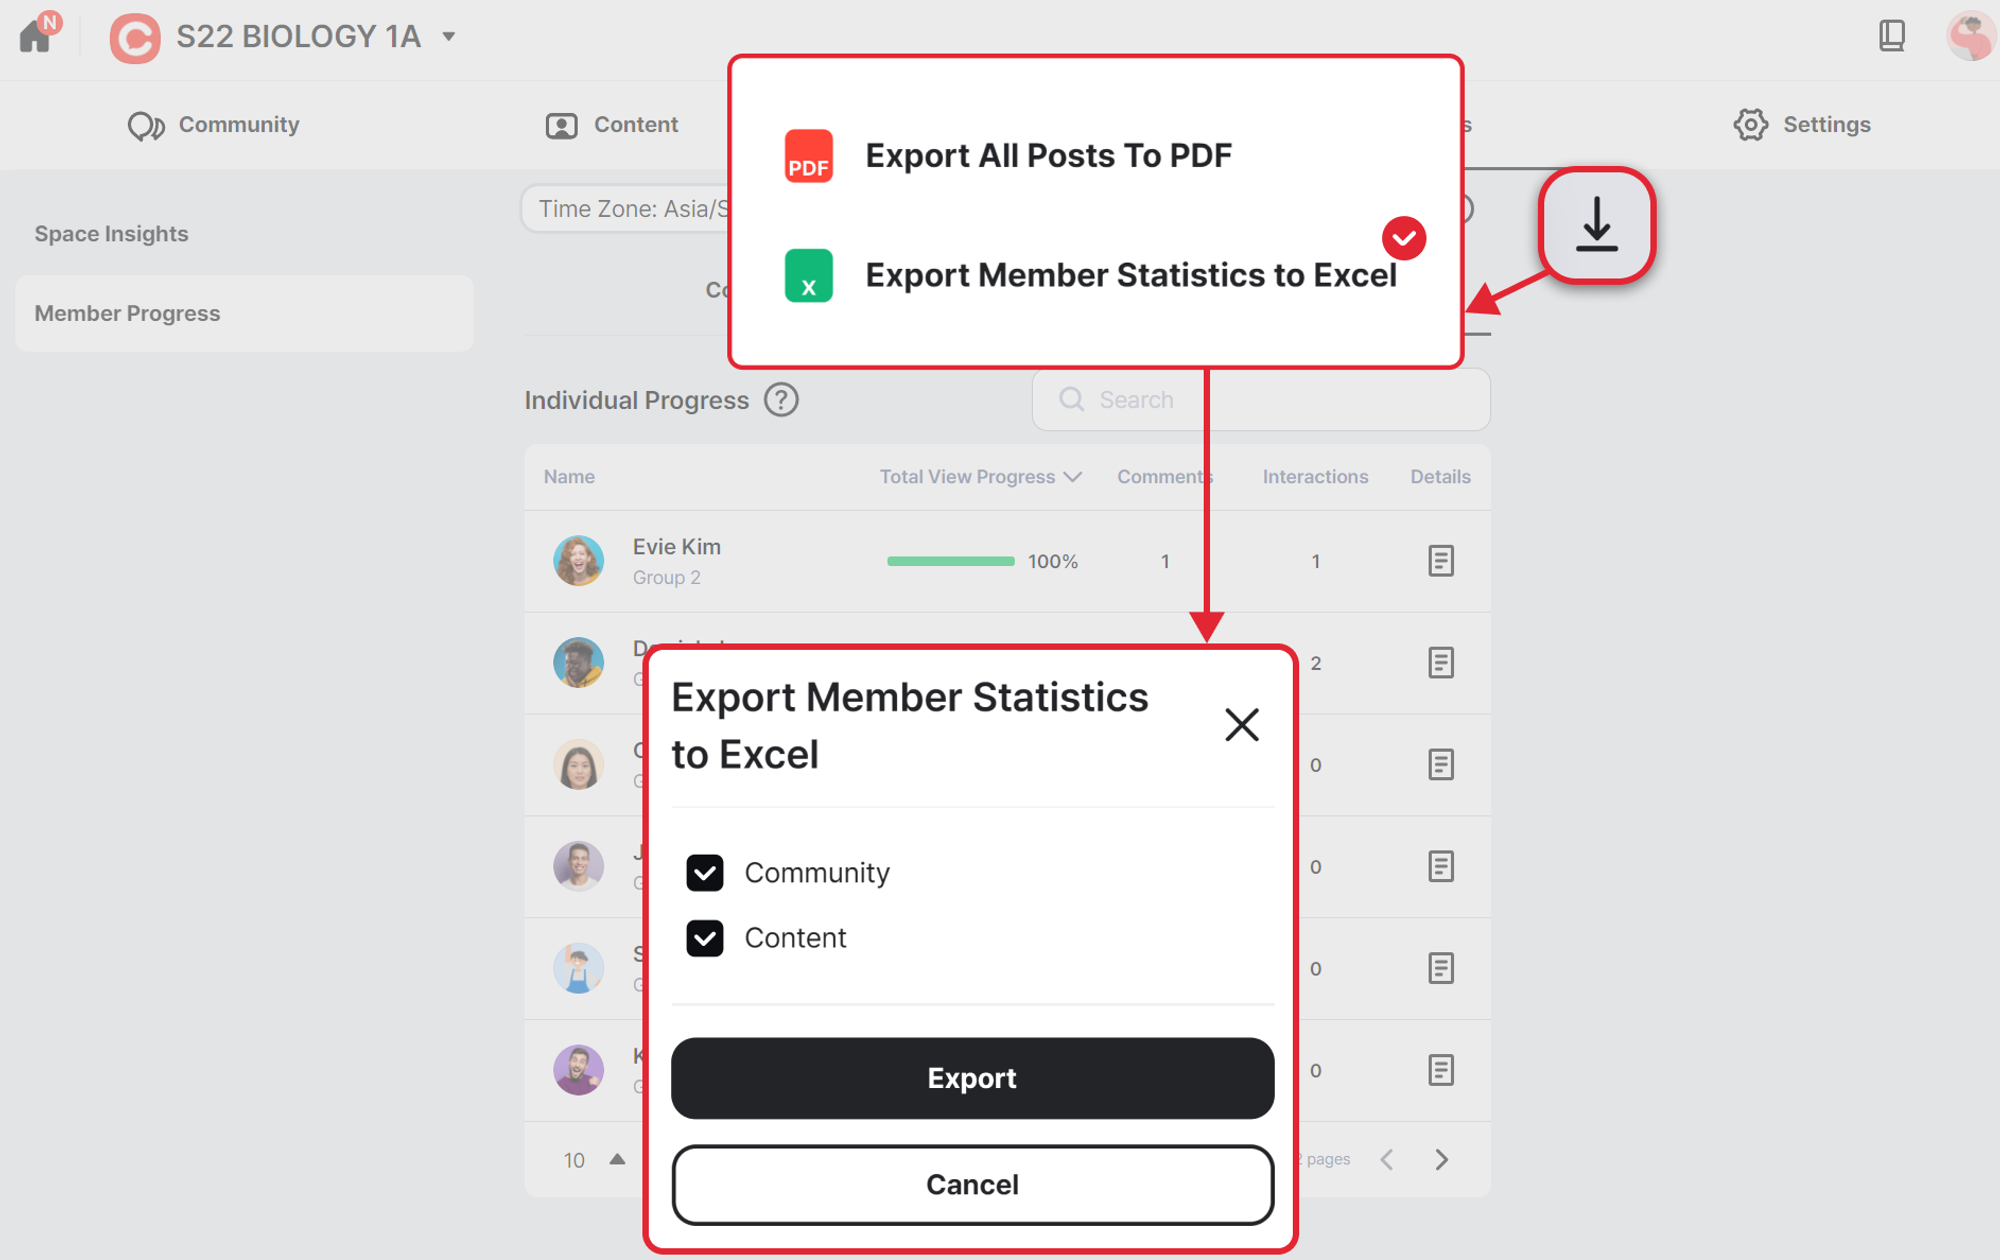
(Picture 6) Export Member Progress to Excel
② Export Member Statistics to Excel: You can download member statistics and content progress as an Excel file.
•
Select outstanding members according to participation rates, number of attendance, number of interactions, etc.
•
Check the video progress for each member.
6. My activity - Participant Insights
While admins can see everyone's stats, participants can see their own activity in the My Activity tab.
•
They can see their activity numbers compared to the average numbers of other participants in the space.
•
Participants can use this as a way to motivate themselves with a direct visual representation of their learning activity.
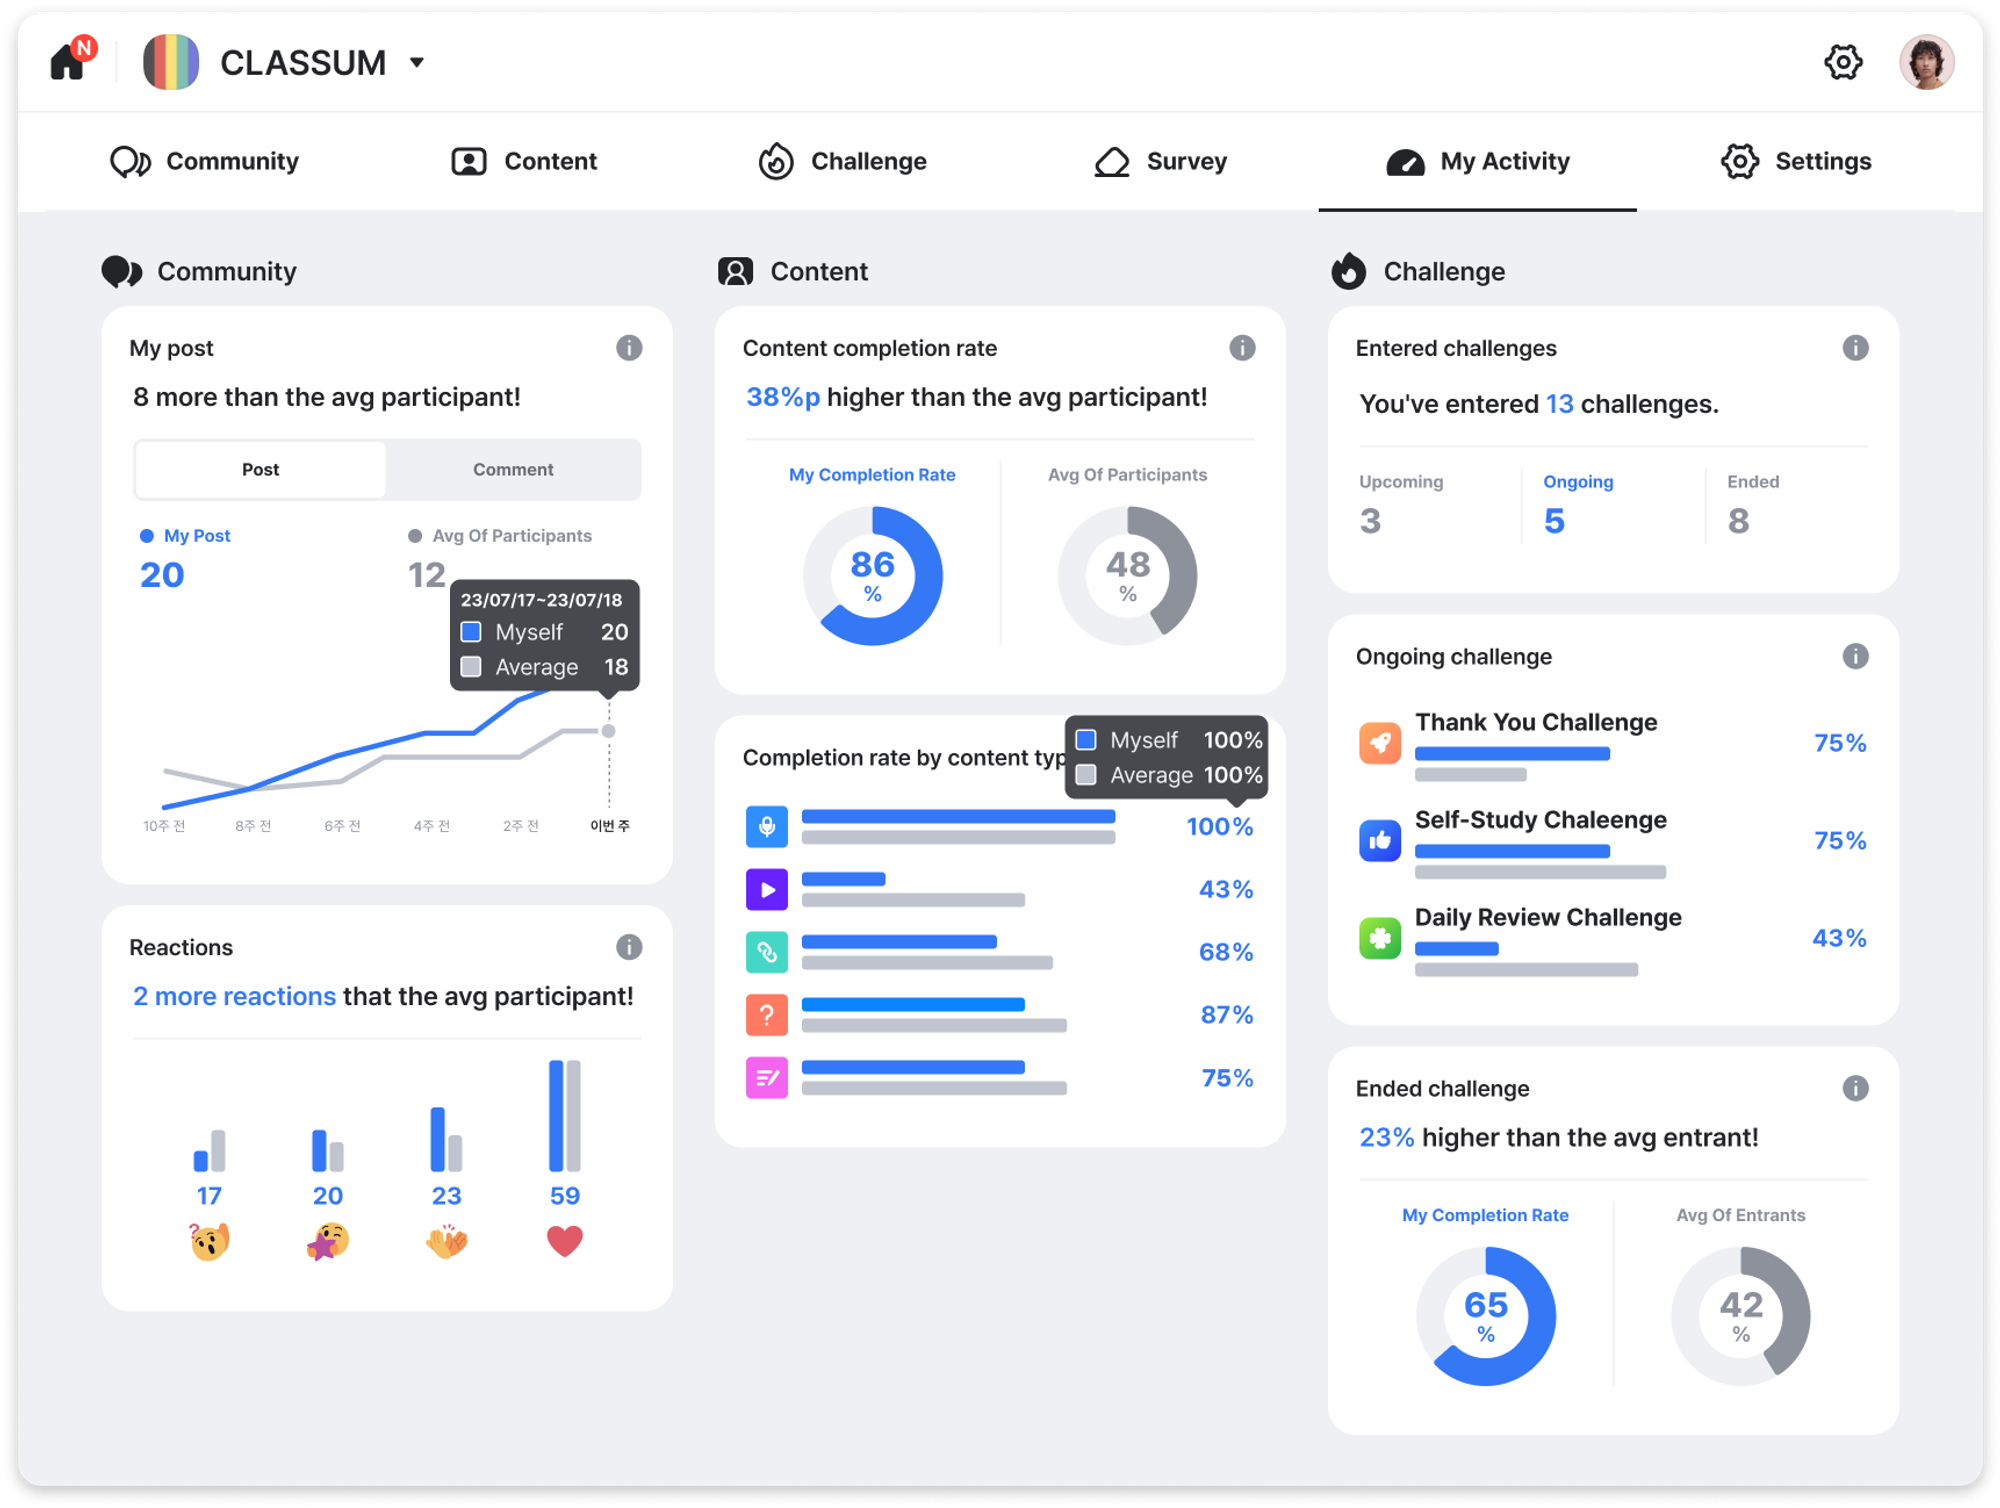
① Community
•
You can see a graphical representation of the number of posts and comments you've made by week.
•
You can see the types of interactions (reactions) you've received.
◦
I'm curious
◦
I'm interested
◦
Liked
◦
Likes (comments)
•
You can see how your activity compares to the average of other participants in the space.
② Content
•
You can see a graph of your content uptake.
•
You can also see how your content is being viewed by type.
•
You can see how your engagement rate compares to the average engagement rate of participants in the space.
③ Challenge
•
You can see which challenges that participants have participated in to date.
•
See which challenges are currently in progress and their achievement rates.
•
You can see the completion rate of closed challenges compared to the average completion rate of space participants.
Please consult directly with our CLASSUM expert. We'll do our best to resolve your issue.
Speak to our CLASSUM expert via 1-on-1 support